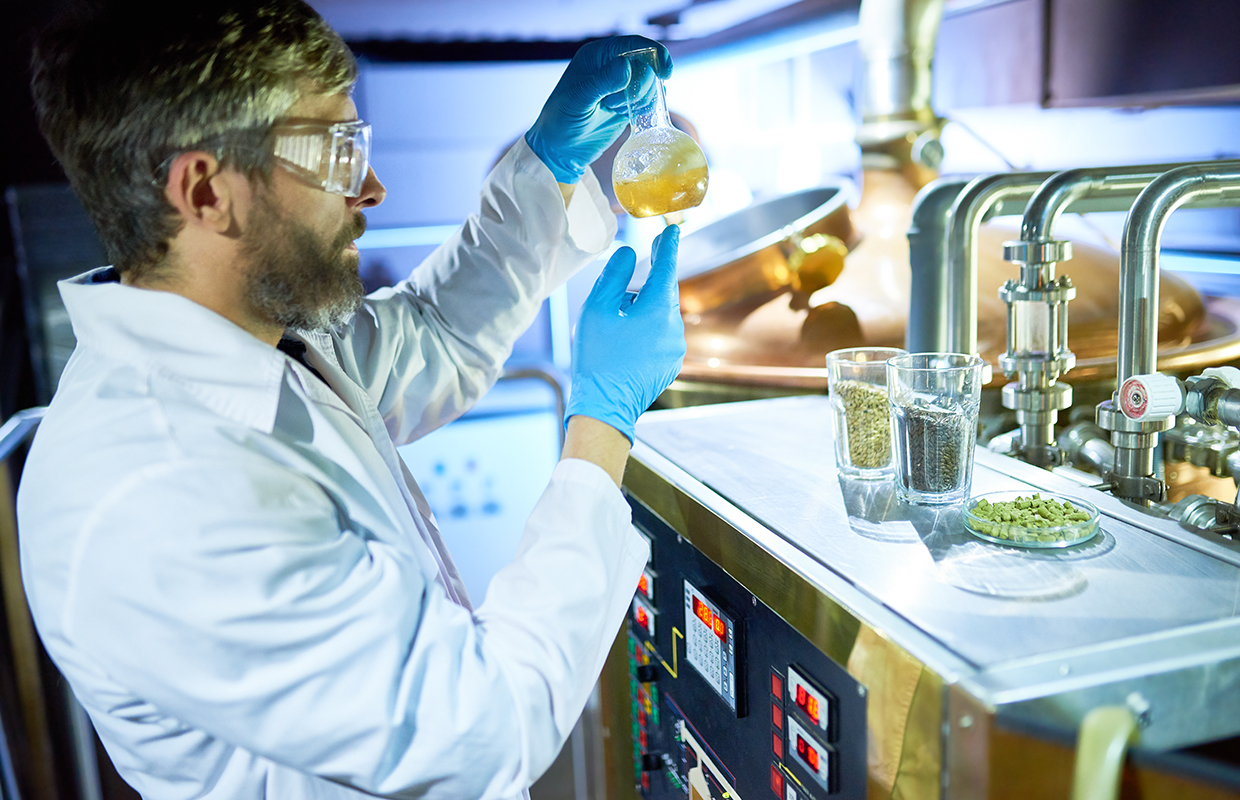
Using a spectrophotometer can expand the scope of what your lab team can test for and what you can quantify while troubleshooting all sorts of fermentation issues.
For Edmund’s Oast Brewing Co. Lab Manager Nicole Steinhilber, it’s been a huge complementary piece of equipment to add to the rapidly growing South Carolina brewery.
“Sensory is crucial. But the advantages to having the specs to improve the beer quality overall and being able to quantify the data is important as well,” she said. “We sort of had the ability to quantify certain metrics, but using the UV-Vis, we’re just able to quantify so many more variables, and it’s nice to have actual data to work off of versus more of like an organoleptic-required metric, which is valuable in its own way. But at some point, the data really speaks.”
Since opening in 2017, Edmund’s Oast has risen to the point of Regional Brewery status with more than 15,000 barrels produced per year and the growth stressed the need for equipment to have on hand like the Thermo Fisher Scientific™ GENESYS™ 150 UV-Vis Spectrophotometer, which the brewery started to implement in August 2021.
“You can use the UV-Vis to analyze compounds, such as free amino nitrogen, which is a key component for a healthy fermentation,” Steinhilber said. “It’s a simple method to prepare samples, basically just plug it right into the UV-Vis, and you can get a free amino nitrogen reading. It just really opens up a huge new window into your processes to help you hone in on what’s happening, to get a better understanding of what’s happening on a data level, and then using that data to make rapid and real-time improvements.”
Steinhilber explained that Edmund’s Oast has utilized the GENESYS 150 UV-Vis Spectrophotometer for many things, and will continue to utilize it for a broad scope of testing, but one of the most frequent uses is to check for vicinal diketones (VDKs).
“Basically, the VDKs, sort of present this buttery flavor, or slickness to the beer, is a compound that’s produced by the yeast during fermentation, but it’s also taken back up by the yeast,” Steinhilber said. “We’ve used the UV-Vis now to dial in all of our different brands to track the concentration of VDKs, and then to be able to monitor and predict when the VDKs will be re-consumed by the yeast so that we can take the temperature down and prepare the beer for packaging.”
Checking for free amino nitrogen is something else that Edmund’s Oast often revisits with the UV-Vis as well to ensure that they are getting enough free amino nitrogen from the malt.
“In beer and in the lab, there’s a wide scope of instrumentation that you can utilize to analyze different things. But for me, the beauty of the UV-Vis is that the application is so wide,” Steinhilber said. “It covers a good 10-15 different ways of looking at the same sample. Even in our lab, we are constantly busting at the seams. So it’s nice to have one small compact unit that we can use on a daily basis for multiple different applications.“
The brewery also uses the spectrophotometer to look at total polyphenols in the beers. It’s just one of a vast array of data points that Steinhilber is excited about having at her fingertips.
“Hazy beers are all the rage right now and trying to accomplish a steady consistent haze, a polyphenol method that you can use that UV-Vis for can be very helpful in developing haze and understanding the stability of the haze,” she said. “Alcohols is another thing that you can dive into, just to understand different alcohols that are formed during fermentation. Those can be analyzed with a UV-Vis, which is something else that we’re looking forward to utilizing.
Analyzing and tracking bitterness units through the brewery can help become more consistent with your hop additions and it’s another part of the checklist that the UV-Vis has been helping Edmund’s Oast with.
“Over the long run, you can save money by understanding the bitterness units that are being added,” Steinhilber said. “There’s a lot of hype about triple dry-hopped hazy IPAs. Well, what’s the return on the bitterness units from all those dry hop additions? That’s something that we’re diving into now to achieve the same sensory values using the data metrics to dial it in.
You can also validate hop storage methods because the Alpha acids oxidatively degrade and become Beta acids. So you can actually audit your own storage processes to make sure that you’re maintaining the Alpha acids in the hops over time.“
“Just putting together all these metrics can give you a really nice picture of the beer on a data level. Which is invaluable.“
Edmund’s Oast decided to opt for the Thermo Fisher Scientific™ Beercraft™ Software option because Steinhilber said it’s nice to have all of the settings preset on the GENESYS UV-Vis spectrophotometer.
“It just sort of makes our day go easier,” she said. “It also removes the opportunity for human error and put in the wrong settings. Everything is pre-programmed, which makes it really plug-and-play. As long as the method is performed accurately, then there’s not much to go wrong.”
Working with Thermo Fisher Scientific even before the purchase was very easy, Steinhilber said. “It was nice to talk to David Barrow, who is our sales rep, and I still communicate with him,” she said. “He’s been extremely helpful. He drove here, he brought us the UV-Vis model to look at and experiment with before we purchased our own.
“He helped educate us on the Beercraft Software portion and why that might be helpful for us, which was very helpful. Overall, it’s been a really positive experience.”


Be the first to comment